The University of Twente's carbon footprint report over 2022 is available. In this report, which UT has published annually since 2014, you will find all the information on emissions caused on campus itself, as well as by external suppliers, commuting and business trips. In 2022, reported carbon emissions have dropped substantially, mainly because UT has purchased green electricity as well as emission offsets for its gas use since this year. UT remains committed to further reducing emissions and reducing energy consumption on campus.
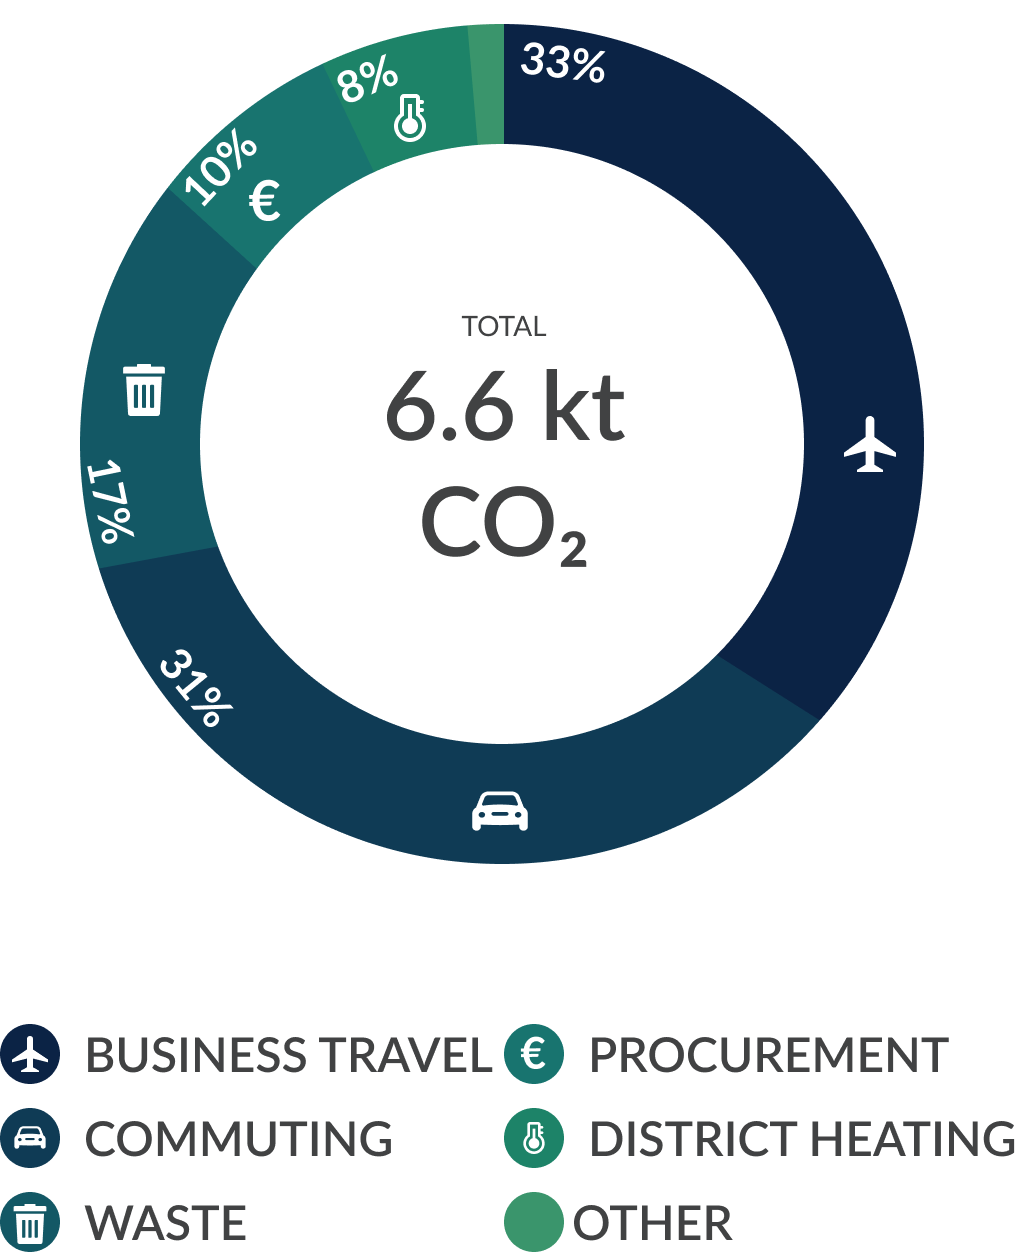
TOTAL carbon footprint 2022
CARBON FOOTPRINT 2018-2022
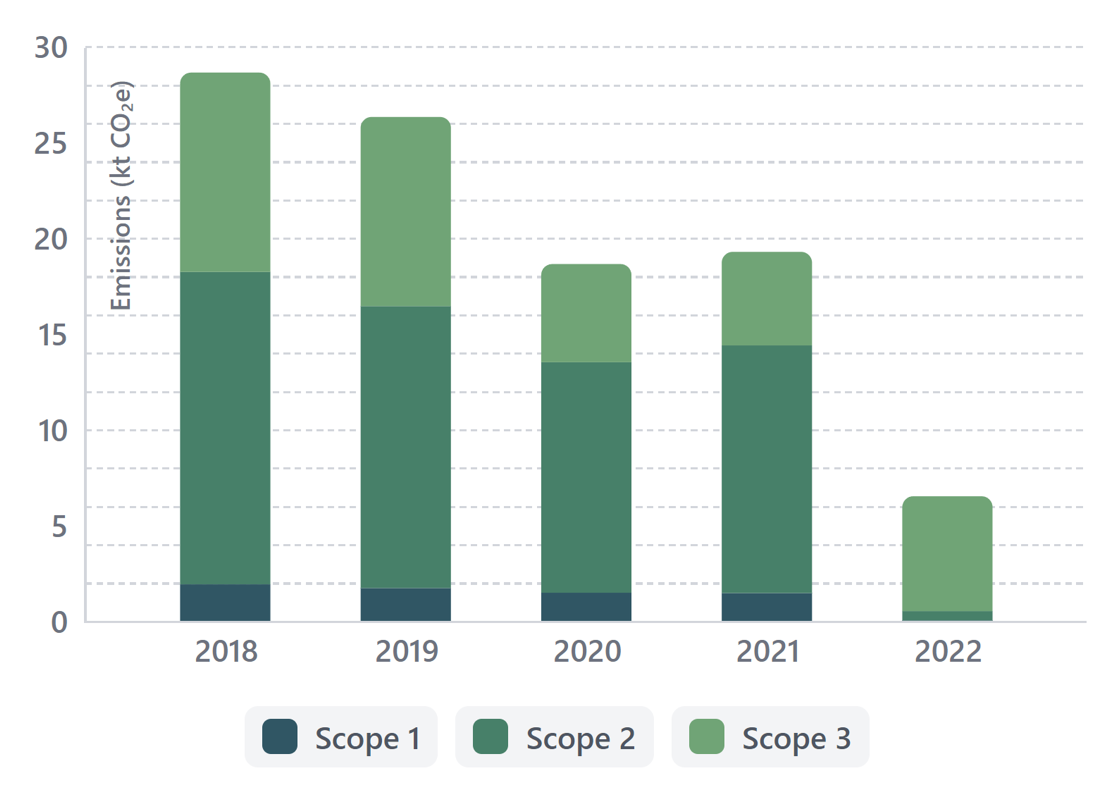
Substantial drop
UT's reported carbon emissions fell from 19.1Ktonnes in 2021 to 6.6Ktonnes in 2022. Most of this drop can be attributed to the fact that since 2022, UT has purchased green electricity through Guarantees of Origin (GoO) and has compensated its emission from gas consumption through Voluntary Emission Reduction (VER) certificates. Emissions from mobility have also decreased. This is because air travel in 2022 was still lower than in 2019 (the last year before corona) and emissions from commuting decreased (see text box).
Less consumption, more generation
"We are happy that we are now buying green electricity and offsetting emissions from our gas use," says Brechje Marechal, Environment & Sustainability Policy Advisor. "But offsetting emissions is not a definitive solution; preventing emissions in the first place is of course better than compensating after the fact. That is why we remain committed to lower energy consumption and more energy generation on campus." UT is also working to further reduce emissions in other ways. "For example, by including sustainability requirements in new tendering processes, promoting the train for business trips within Europe with the Train Map and making work lunches vegetarian by default. Within the Campus & Facility Management department -as well as elsewhere in the organization- this is a priority, so we will continue this in the coming years."
Gas, heat and electricity
Gas consumption at UT has fallen by more than 29% since 2019, thanks to various conservation measures and connecting several buildings to the regional heat network (link in Dutch) instead of gas-fired heating. Most of the remaining gas consumption is caused by humidifying the air in laboratories. CFM is currently investigating whether there is an alternative to this.
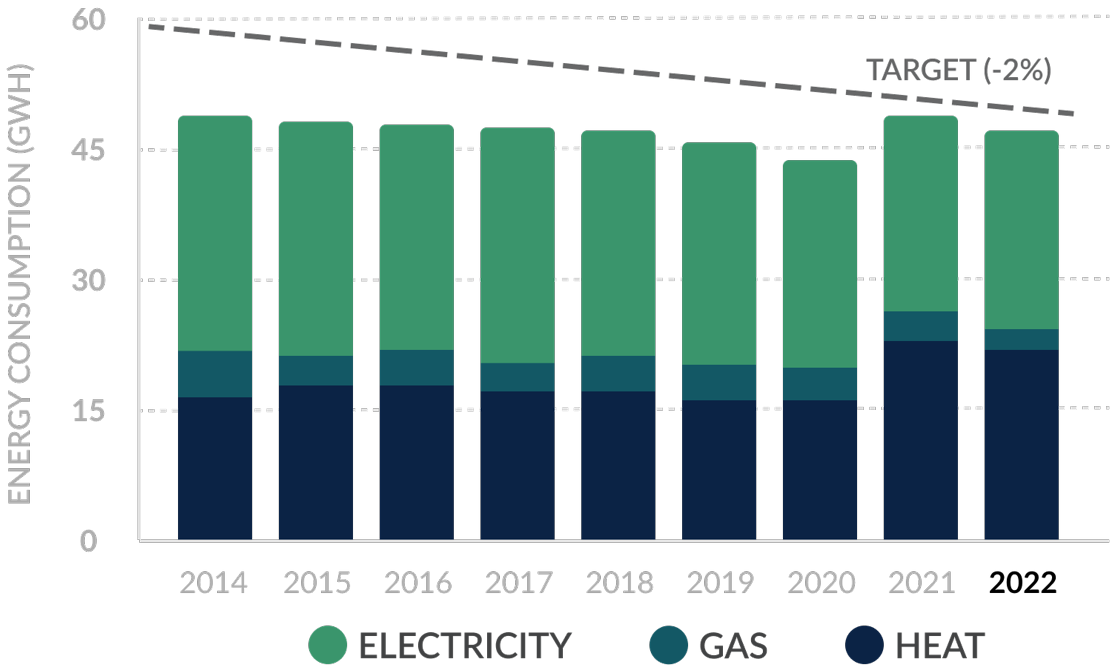
The consumption of heat from the heat network (+17%) and electricity (+6%) has increased somewhat since 2019. The increased heat consumption can be explained by more buildings being connected to the heat network and increased ventilation requirements during the corona pandemic. The growth in electricity consumption can be attributed to further growth of the university. In the coming period, further steps will be taken in the efficiency of technical installations. Another important step is focusing on behavioral change, such as encouraging the use of the standby mode of research equipment where possible, closing fume cupboards and turning off lamps and monitors.
Between 2005 and 2020, power consumption at UT has fallen by more than 39%, despite a sharp increase in the number of staff and students during that period.


