The University of Twente strives to be CO2 neutral by 2030. Every year since 2014, the UT publishes a carbon footprint report. This report is available via a digital dashboard: utwente.nl/footprint. Older reports can be found at the bottom of this page.
The carbon footprint calculates the greenhouse gas emissions resulting from the University’s activities as well as from the products and services it acquires. UT has been calculating its CO2 footprint since 2014 following the greenhouse gas protocol which divides the emissions into three scopes, depending on the origin of the emissions. Part of the information the GHG protocol requires UT to record is published here in order to keep the CO2 report concise and readable for a broad audience.
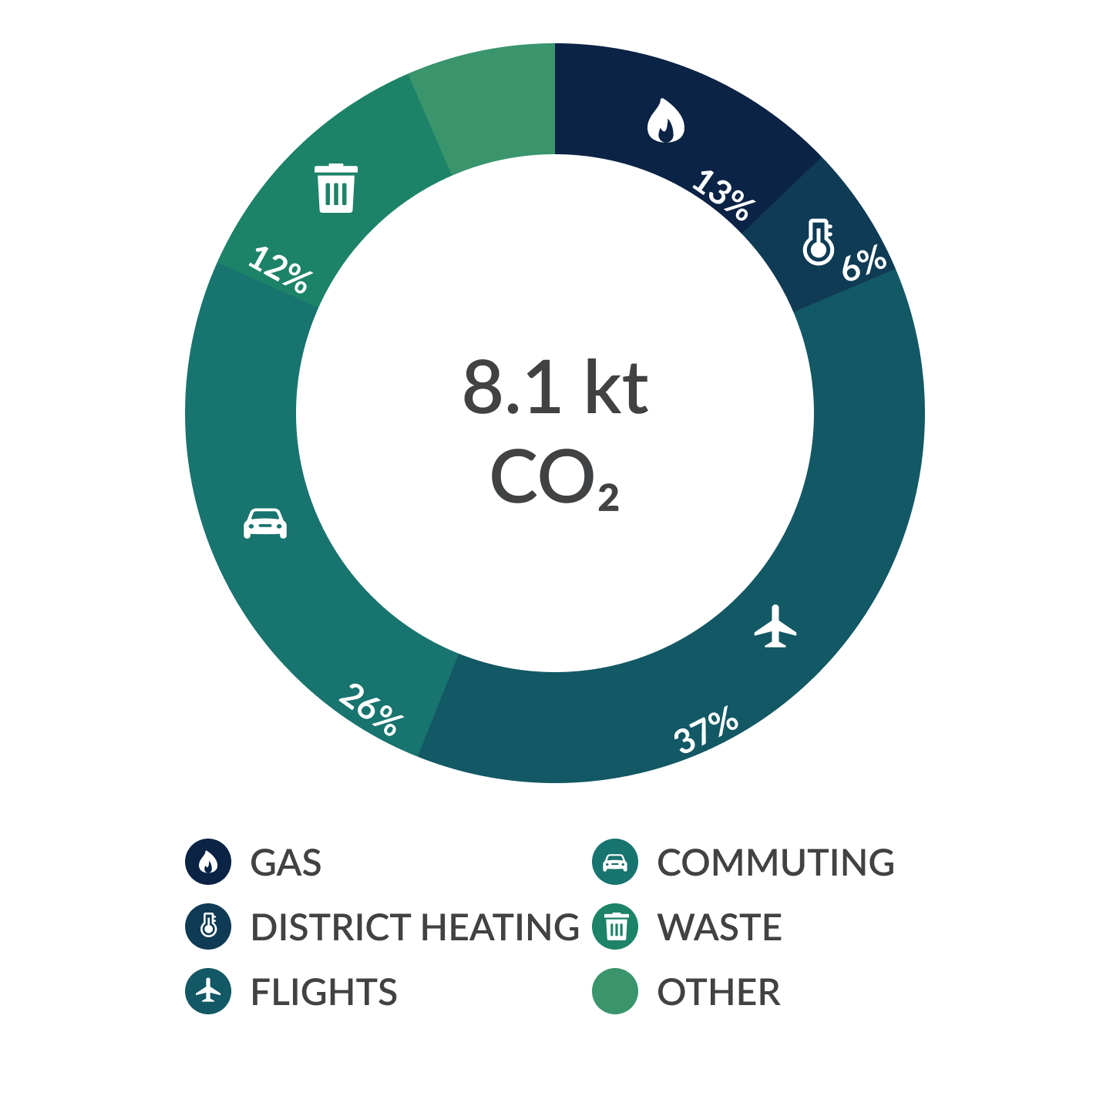
Total CO2 emissions 2023
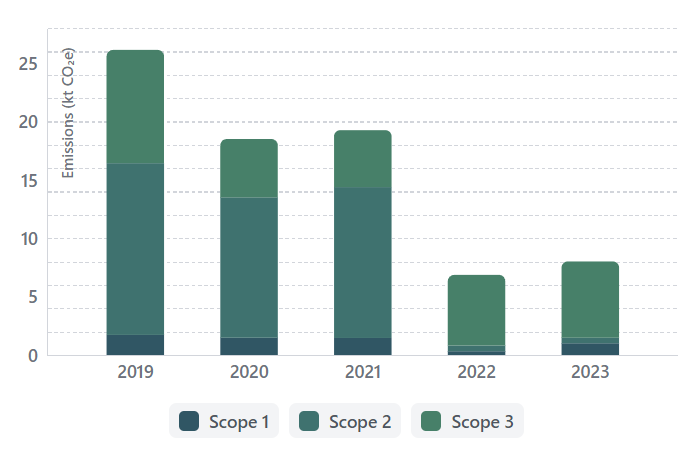
Carbon footprint development
- Changes in 2023
The carbon footprint of 2023 with 8.1 kton is a significant reduction from 2019, but an increase from 2022's 6.6 kton. This increase is caused by two factors: unlike in 2022, UT did not compensate for emissions caused by gas consumption through Voluntary Emission Reduction (VER) because of discussions about its effectiveness, which leads to more emissions on paper. When the compansation in 2022 is removed, the total emissions from 2022 amounted to 8.3kton. Instead, UT futher reduced the use of gas on campus, and will continue to do so. The total energy consumption (gas, heat and electricity) in 2023 dropped significantly when compared to 2022, after an increase in the corona period due to increased ventilation demands.
Secondly, business travel by UT staff increased in 2023 compared to 2022 through all modes of transportation. The increased number of flights more than compensated for gains made in other areas. UT continues to encourage alternative modes of transportation such as the train through the Train Map.
The sharp drop in emissions in 2023 compared to 2019 is largely attributable to the fact that UT now buys green electricity. That means that on paper, the emissions of electricity went to 0 since 2022. Because preventing emissions is better than compensating them, UT focuses on more electricity generation on campus through solar panels and reducing energy use through various means. Gas use was reduced by 44% since 2019, largely due to more buildings being connected to the heat network instead of being heated by gas. UT will continue to work on lowering its energy use in the future.
TRIAS ENERGETICA
Since 2005 UT been part of the Long Term Agreements on energy efficiency. The essence of the agreements was to realise a reduction in energy consumption of 30% over 15 years. UT more than realized this reduction with a reduction in energy consumption of 39% in that period. The approach taken focusses on the Trias Energetica: limiting the demand for energy, using sustainably generated energy and when necessary, use energy generated by fossil fuels as efficiently as possible. At the page on Energy initiatives you can find more detail on what specific measures have been implemented. Also information on the Energy Roadmap (developed as part of the national Climate Agreement) can be found there.
Would you like to know more about initiatives at UT to reduce our carbon footprint? Take a look at utwente.nl/sustainability.
- Additional information related to the GHG protocol
Two methodologies that are widespread to calculate the carbon footprint are the greenhouse gas protocol and the ISO 14064 standard. These standards ask to detail the following information. In order to keep the main CO2 report concise and clear, this supporting information is only detailed here.
The greenhouse gas protocol was developed by the World Resources Institute (WRI) and the World Business Council on Sustainable Development (WBCSD). The protocol provides standards and guidance for preparing a greenhouse gas emissions inventory. The principles underpinning this protocol are: relevance, completeness, consistency, accuracy and transparency.
Contact person UT for carbon footprint: Brechje Maréchal
Reporting period: Yearly, latest version: 2023
Base year: 2019
Organisational boundaries
All buildings that UT manages are included in the organizational boundary. Student housing and buildings managed by external companies are not included; buildings that are off-campus such as the ITC faculty building and ITC hotel are included. Appendix I of the 2019 CO2 footprint report contains a list of all buildings that have been included in the carbon footprint.
Operational boundary
The operational boundary involves the identification of the emissions associated with UT’s operations. These emissions are categorized as direct and indirect emissions and divided into scope 1, 2 and 3. Direct emissions are emissions from sources that are controlled by the company. Indirect emissions are emissions that do not occur on campus but are a result of the activities UT conducts.
Scope 1: Direct emissions – GHG emissions due to gas consumption for air humidification and heating, fuel consumption of vehicles owned by UT and the refilling of air conditioning systems with refrigerants.
Scope 2: Indirect emissions – GHG emissions from the generation of purchase of electricity which is consumed by UT.
Scope 3: Indirect emissions – GHG emissions due to the activities by UT which are not in the control of UT.
Scope 3 is optional. UT strives to include as much data as possible which is relevant and for which reliable information can be obtained.
The GHG protocol has several categories scope 3 emissions that need to be assessed:
- Extraction and production of materials and fuels
- Transport-related activities
- Transportation of purchased materials or goods
- Transportation of purchased fuels
- Employee business travel
- Employee commuting to and from work
- Transportation of waste
- Electricity-related activities
- Fuel and fuel use not included in scope 1 and 2
- Fuel and fuel use not included in scope 1 and 2
- Leased assets, outsources activities
- Use of sold products and services
- Waste disposal
- Disposal of waste generated in operations
- Disposal of waste generated in the production of purchased materials and fuels
- Disposal of sold products at the end of their life
In order to determine which scope 3 categories are relevant, the protocol suggests to consider emissions that 1. are large relative to the scope 1 and 2 emissions, 2. contribute to the strategy of the organisation, 3. are deemed critical by stakeholders, 4. are emissions that can be influenced by UT.UT decided to focus since 2019 on the categories also mentioned in the UT strategy : Water, waste, procurement, mobility: commuting and business travel. Mobility is a major GHG-generating activity.
UT has many contracts, large and small. Some suppliers have all the CO2 data available, others not yet. The aim is to increase the input received from all suppliers. By having a more complete overview it shows opportunities where gains can be made. By increasing scope 3 it also becomes clearer what the influence of staff and student’s choices is on scope 3 of the CO2 footprint. It will contribute to increasing awareness of everyone’s impact on the CO2 footprint.
List of scope 3 categories
For 2019 information was received from the following value chain partners: the waste collection company, florist, catering, chemicals, printing, electricity, district heating, green maintenance contractor, hardware, infrastructural works, maintenance installations, office articles (paper), coolants, hotel/meeting locations, maintenance building works, employment agency, public transport, travel agency, rented transportation, launderette and the moving companies. Data on commuting and work travel is included as well.
The data collected by the various companies varies. Some suppliers do not have quantitative data but do take steps to reduce their CO2 footprint and show this by sharing a certificate, for example florist Thuys received the Certificate for Sustainable Florist (silver). UT aims to stimulate the increase in the availability and the reliability of this data by including this as a criterium in tender processes. All data used for these companies was provided to UT by these companies.
Transport related to purchased goods and services have now been included in their integral CO2 reporting while in previous years the GHG emissions of transport and deliveries to the university was estimated separately. Therefore, since 2019 this is not indicated separately anymore.
Transport data for commuting dates from a survey conducted by UT in 2011. We aim to update this data this year to be able to include a more accurate figure for the CO2 footprint of 2020. Due to the corona measure of working from home, this update may have to be postponed until the commuting movements have normalised. Business travel data is provided by the travel agency which books all flights. There seems to be a difference in calculations of the CO2 emissions between companies and this will be further analysed in the following CO2 footprint reports.
Leased assets have not been included into the CO2 footprint of 2019.
Quantification methods
The quantification of scope 1 emissions comes from the energy meters of UT buildings and from the gas provider, the refrigerant provider and for fuel consumption by UTs own vehicles the record of the petrol usage was used. The details of scope 2 emissions come from the energy meters at UT buildings complemented by the electricity and district heating companies. This data is very accurate and reliable.
The quantification of scope 3 emissions is dependent on the methodology used by the relevant company. Emission factors used are taken from this list of standard emission factors. For train travel the data provided by the Dutch Railways is used, for commuting the data from the 2011 survey on commuting adjusted for increasing student and staff numbers. The commuting data needs updating but using the available numbers adjusted for increased staff and students are the best available option for 2019.
Changes compared to previous years
The Dutch electricity mix changed in 2017. While the consumed energy did not increase, the emissions related to this did. The reference figures used for the calculations of the emissions are nationwide figures and this lies outside of our control.
District heating used from 2014 to 2018 was considered ~ 50% CO2-neutral (heat derived from the burning of waste). In 2018 onwards, the district heating delivered to UT is considered 100% CO2-neutral as it comes from the bio-energy installation.
Reference documents
Download older reports
- 2023 CO2 footprint UTPDF, 12MB
- 2022 CO2 Footprint UTPDF, 28MB
- 2021 CO2 Footprint UTPDF, 24MB
- 2020 CO2 Footprint UT - Management SummaryPDF, 3MB
- 2020 CO2 Footprint UTPDF, 12MB
- 2019 CO2 Footprint UT - Management SummaryPDF, 2MB
- 2019 CO2 Footprint UTPDF, 7MB
- 2018 CO2 Footprint UTPDF, 3MB
- 2017 CO2 Footprint UTPDF, 636kB
- 2016 CO2 Footprint UTPDF, 675kB
- 2015 CO2 Footprint UT - scope 1&2PDF, 1MB
- 2015 CO2 Footprint UT - scope 3PDF, 578kB
- 2014 CO2 Footprint UTPDF, 4MB