Travelling by train in Europe
Are you travelling for study, work – or just to visit new places? Do you want to travel comfortably, but limit your impact on the environment as much as possible? Then look no further: the UT Train Map shows what destinations can easily be reached by train instead of airplane – and how much CO2 you save by choosing this option.
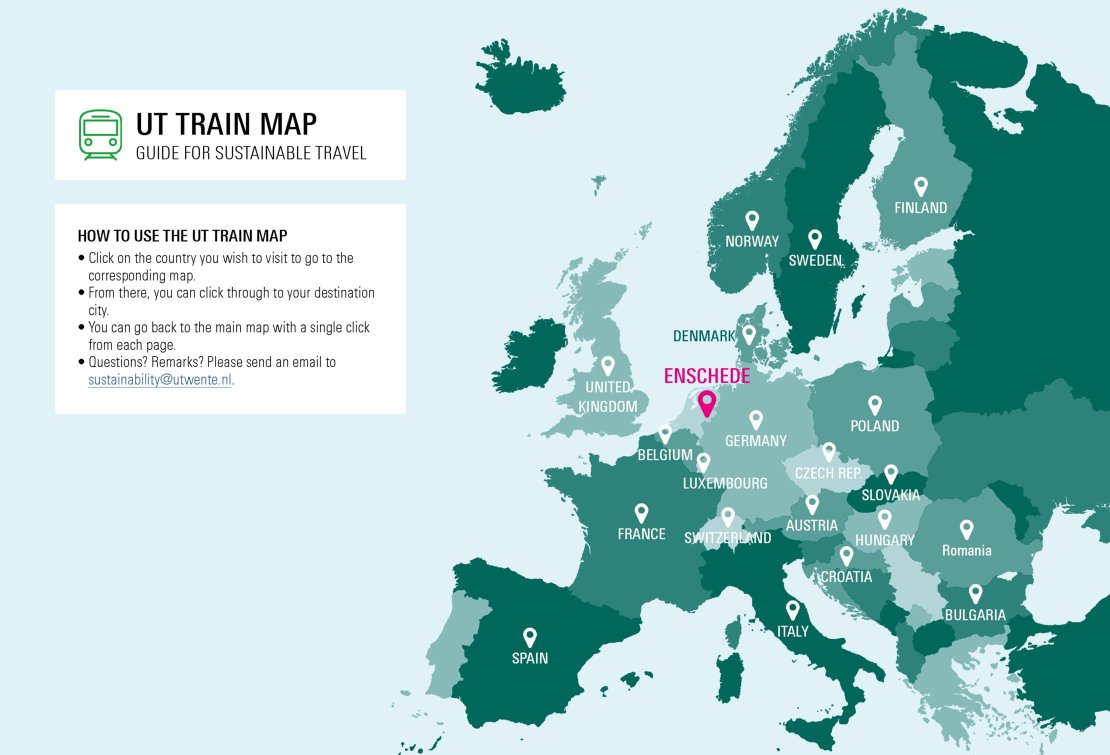
At the University of Twente, the train is the default mode of travel whenever possible. The Train Map is a tool to check whether or not a trip from Enschede to a city in Europe can easily be taken by train. This map shows the cities that members of UT’s community regularly travel to. These cities are divided into three categories: cities where UT considers the train the default mode of travel, cities where the train is recommended and cities where the train is considered a challenging option. For each destination, the map shows the travel times and CO2-emissions from the trip by train and plane. The map makes it easy to check if the train is a good option for your trip, so it's easy to make a more sustainable choice.
The map
Click the image to open the Train Map (PDF, 8MB).

More information
Commuting and business travel together cause around 31% of the CO2-footprint of the University of Twente. Therefore, mobility is one of the priority areas to focus on for improving the sustainability of our organisation. The Train Map was developed as an easy-to-use guide to help members of our community reduce their footprint through travelling by train instead of by plane.
This map shows the cities that members of UT’s community regularly travel to. These cities are divided into three categories: cities where UT considers the train the default mode of travel, cities where the train is recommended and cities where the train is considered a challenging option.
The cities on the map are selected based on the number of times a work trip was booked through University of Twente’s travel unit, plus cities where the University of Twente has a partner institution (Erasmus, ECIU, CESAER, etc.). This list is not meant to be exhaustive, but it aims to give a good overview which locations you can reach by train.
Why is travelling by train instead of the plane important? Mobility is an important contributor to the CO2-footprint of the UT. In 2019 (pre-corona), flights alone constituted 13% of the emissions of our university. In Shaping2030, reducing travel is explicitly a goal:
“In order to reduce travel, our people will be fully accustomed to using digital technologies for conferencing. When travel is unavoidable, we will no longer use airlines for <800km trips.”
Thus, the UT wants its employees and students to use more sustainable modes of travel where possible. The Train Zone map is a tool to create awareness about the environmental impact of travel choices. The end goal is to lower the CO2 footprint of business and study travel, thus contributing to our sustainability goals.
How are the travel times and CO2-emissions determined? The calculated travel time takes into consideration the aspects below:
The CO2-emissions in this document are calculated with www.ecopassenger.org, an online tool that compares the energy consumption, CO2 and exhaust atmospheric emissions for planes, cars and trains for passenger transport.
The fastest option is visualized for all travel options. Travel time is based on travel from the centre of Enschede to the centre of the destination city (station to station). It is assumed flights are taken from Schiphol Airport and that travel to Schiphol is by train. Therefore, 2 hours travel time to Schiphol Airport is taken into account. For plane travel check in, security and luggage at Schiphol and the destination are taken into account. Therefore, 2,5 hours of extra travel time is added.
The number of transfers includes transfers from train to plane and from plane to train, car or taxi at the destination city.
The travel duration and number of transfer information for each mode of transport is obtained from various travel resources such as NS International, Deutsche Bahn, Google Maps, and the Trainline. Duration of travel by car and electric car assume that the journey is non-stop, not including charging/refuelling the car or rest time.
All travel times and emissions are an indication: they may differ based on the day, time of travel and the exact route.
Feedback
If you have questions or remarks about the train map, please send an email to sustainability@utwente.nl.